Arbuckle Wells Status Updates
Del Oro Water field personnel routinely measure the static level of water in our wells. As Arbuckle’s wells share an aquifer with surrounding agricultural operations, it is especially important to monitor the level as they can be drawn down quickly by those operations.
The reporting measurement is water level (feet) above well pump. This makes it easier to visualize the current water level. Reporting has been simplified to one level per month to make it easier to compare across years. Larger numbers mean more water is available.
Arbuckle – Water Level as Feet Above Well Pump
| ARBUCKLE WELL WATER LEVEL | |||||||||
|---|---|---|---|---|---|---|---|---|---|
| (Feet Above Well Pump) | |||||||||
| 2024 | 2023 | 2022 | 2021 | 2020 | 2019 | 2018 | 2017 | 2016 | |
| Jan | 201 | 180 | 189 | 208 | 226 | 226 | 231 | 227 | 215 |
| Feb | 210 | 180 | 189 | 213 | 224 | 231 | 213 | 230 | 216 |
| Mar | 213 | 185 | 189 | 203 | 219 | 236 | 222 | 234 | 218 |
| Apr | 213 | 199 | 164 | 178 | 206 | 219 | 217 | 234 | 214 |
| May | 215 | 196 | 152 | 129 | 189 | 223 | 203 | 219 | 195 |
| Jun | 213 | 176 | 134 | 120 | 180 | 213 | 189 | 198 | 177 |
| Jul | 164 | 118 | 118 | 159 | 185 | 178 | 185 | 170 | |
| Aug | 159 | 129 | 127 | 157 | 185 | 182 | 176 | 178 | |
| Sep | 159 | 104 | 139 | 176 | 189 | 194 | 172 | 183 | |
| Oct | 180 | 143 | 152 | 176 | 192 | 196 | 196 | 189 | |
| Nov | 180 | 157 | 162 | 180 | 194 | 199 | 219 | 208 | |
| Dec | 189 | 173 | 176 | 199 | 196 | 196 | 222 | 221 |
Arbuckle – Water Level as Feet Above Well Pump
[supsystic-table-diagram id=’19’]
Arbuckle – Water Level as Feet Below Surface
| ARBUCKLE - WELL WATER LEVEL | |||||||||
|---|---|---|---|---|---|---|---|---|---|
| (As Feet Below Surface) | |||||||||
| 2024 | 2023 | 2022 | 2021 | 2020 | 2019 | 2018 | 2017 | 2016 | |
| Jan | 171 | 192 | 183 | 164 | 146 | 146 | 141 | 145 | 157 |
| Feb | 162 | 192 | 183 | 159 | 148 | 141 | 159 | 142 | 156 |
| Mar | 159 | 187 | 183 | 169 | 153 | 136 | 150 | 138 | 154 |
| Apr | 159 | 173 | 208 | 194 | 166 | 153 | 155 | 138 | 158 |
| May | 157 | 176 | 220 | 243 | 183 | 149 | 169 | 153 | 177 |
| Jun | 159 | 196 | 238 | 252 | 192 | 159 | 183 | 174 | 195 |
| Jul | 208 | 254 | 254 | 213 | 187 | 194 | 187 | 202 | |
| Aug | 213 | 243 | 245 | 215 | 187 | 190 | 196 | 194 | |
| Sep | 213 | 268 | 233 | 196 | 183 | 178 | 200 | 189 | |
| Oct | 192 | 229 | 220 | 196 | 180 | 176 | 176 | 183 | |
| Nov | 192 | 215 | 210 | 192 | 178 | 173 | 153 | 164 | |
| Dec | 183 | 119 | 187 | 173 | 176 | 176 | 150 | 151 |
Arbuckle – Water Level as Feet Below Surface
[supsystic-table-diagram id=’15’]
The higher the numbers on the graph the lower the water level
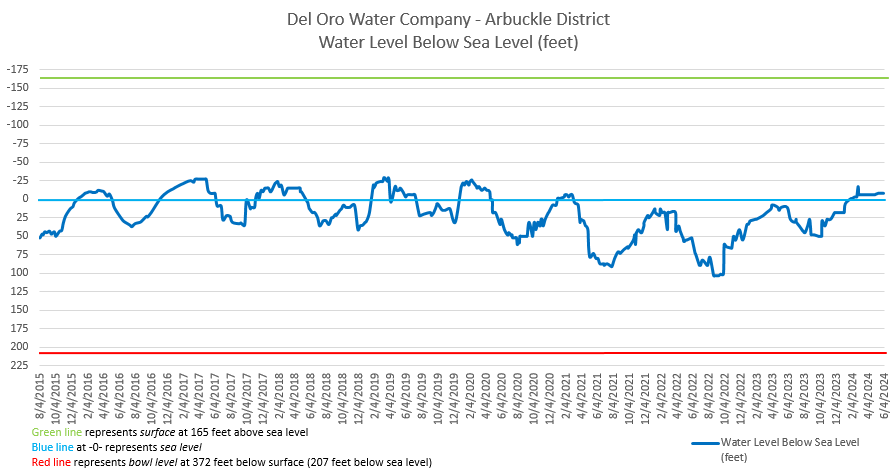
Arbuckle – Water Level Below Sea Level
| ARBUCKLE - WELL WATER LEVEL | |||||||||
|---|---|---|---|---|---|---|---|---|---|
| Feet Below Sea Level (Arbuckle is at 165 feet above sea level) | |||||||||
| 2024 | 2023 | 2022 | 2021 | 2020 | 2019 | 2018 | 2017 | 2016 | |
| Jan | 6 | 27 | 18 | -1 | -19 | -19 | -24 | -20 | -8 |
| Feb | -3 | 27 | 18 | -6 | -17 | -24 | -6 | -23 | -9 |
| Mar | -6 | 22 | 18 | 4 | -12 | -29 | -15 | -27 | -11 |
| Apr | -6 | 8 | 43 | 29 | 1 | -12 | -10 | -27 | -7 |
| May | -8 | 11 | 55 | 78 | 18 | -16 | 4 | -12 | 12 |
| Jun | -6 | 31 | 73 | 87 | 27 | -6 | 18 | 9 | 30 |
| Jul | 43 | 89 | 89 | 48 | 22 | 29 | 22 | 37 | |
| Aug | 48 | 78 | 80 | 50 | 22 | 25 | 31 | 29 | |
| Sep | 48 | 103 | 68 | 31 | 18 | 13 | 35 | 24 | |
| Oct | 27 | 64 | 55 | 31 | 15 | 11 | 11 | 18 | |
| Nov | 27 | 50 | 45 | 27 | 13 | 8 | -12 | -1 | |
| Dec | 18 | 34 | 22 | 8 | 11 | 11 | -15 | -14 |
Pump is 372 feet below surface which is equivalent to 230 feet below sea level
Arbuckle – Water Level Below Sea Level
[supsystic-table-diagram id=’16’]
The higher the numbers on the graph the lower the water level